Plugin Evaluation
In this evaluation, you will integrate a process mining implementation into Ocelescope by creating a plugin.
The goal is to create a new plugin using the existing Ocelescope system and its documentation.
Let’s say you have already written two Python functions:
-
A discovery function (
discover_dfg) that discovers an object-centric directly-follows graph (OC-DFG) from an Object-Centric Event Log (OCEL).
It returns a list of tuples in the form(activity_1, object_type, activity_2), where each tuple means thatactivity_2directly followsactivity_1, for the givenobject_type.
Start and end activities useNoneto indicate the absence of a preceding or following activity.Example Output of discover_dfg
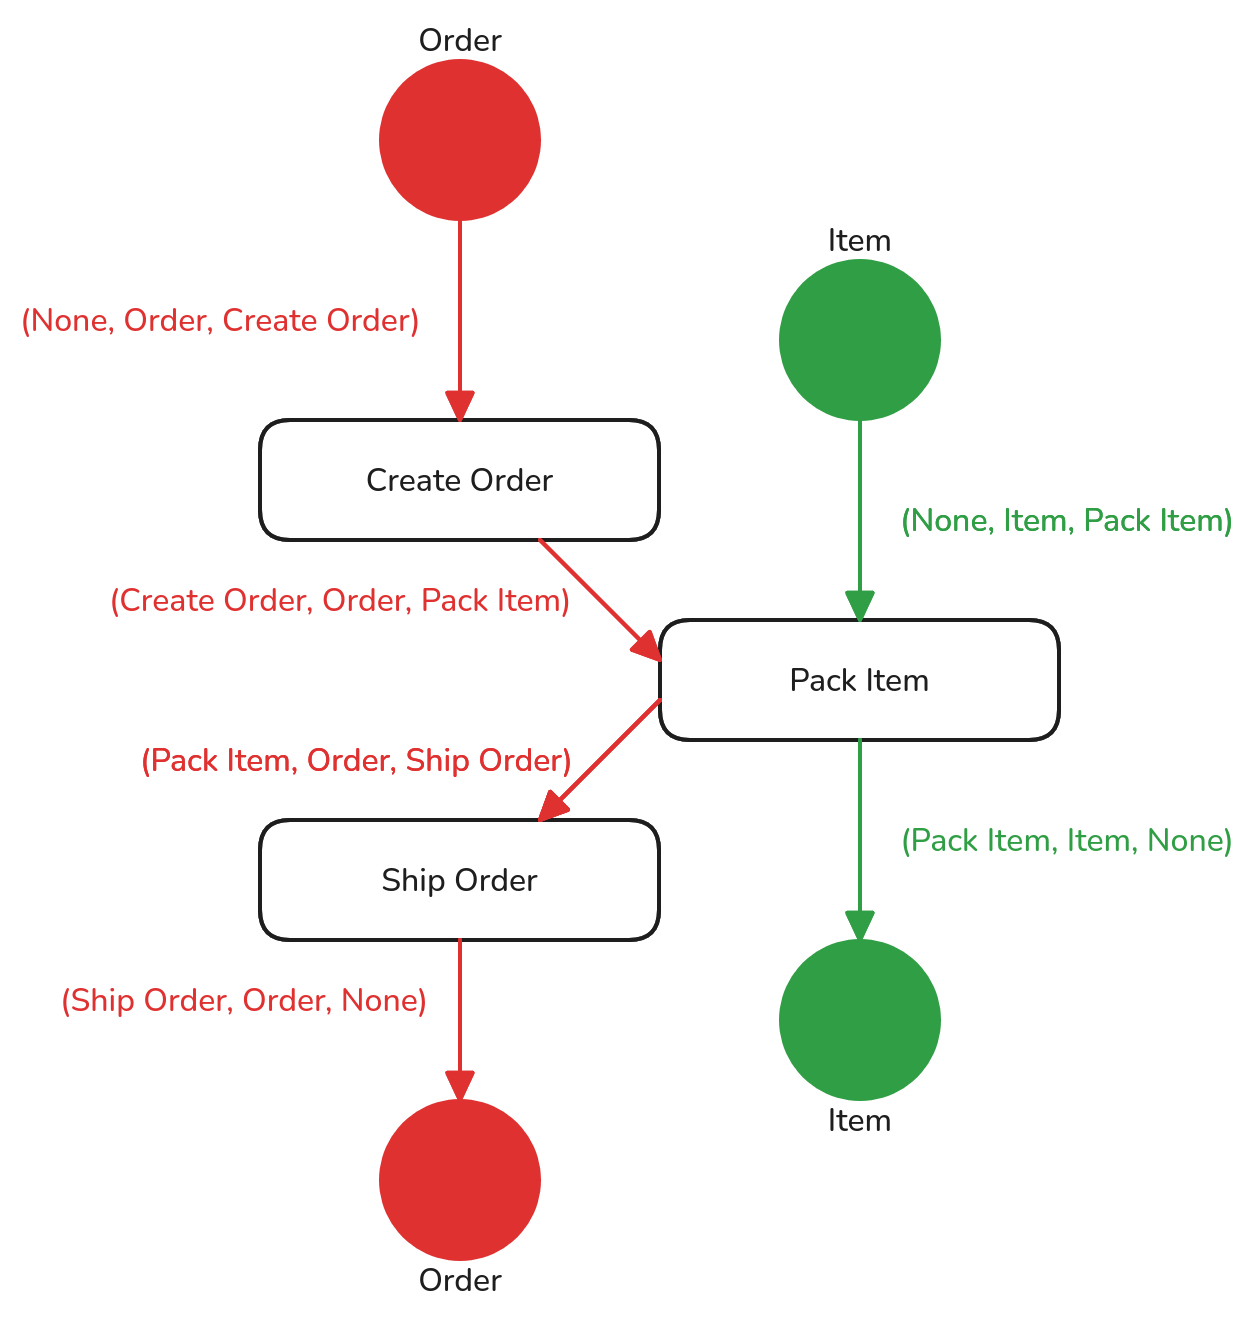
Visualization of a possible output from discover_dfg:
[(None, Order, Create Order), (Create Order, Order, Pack Item), (Pack Item, Order, Ship Order), (Ship Order, Order, None), (None, Item, Pack Item), (Pack Item, Item, None)]. -
A visualization function (
convert_dfg_to_graphviz) that creates and returns a GraphvizDigraphinstance representing the DFG, which can later be used to generate images.
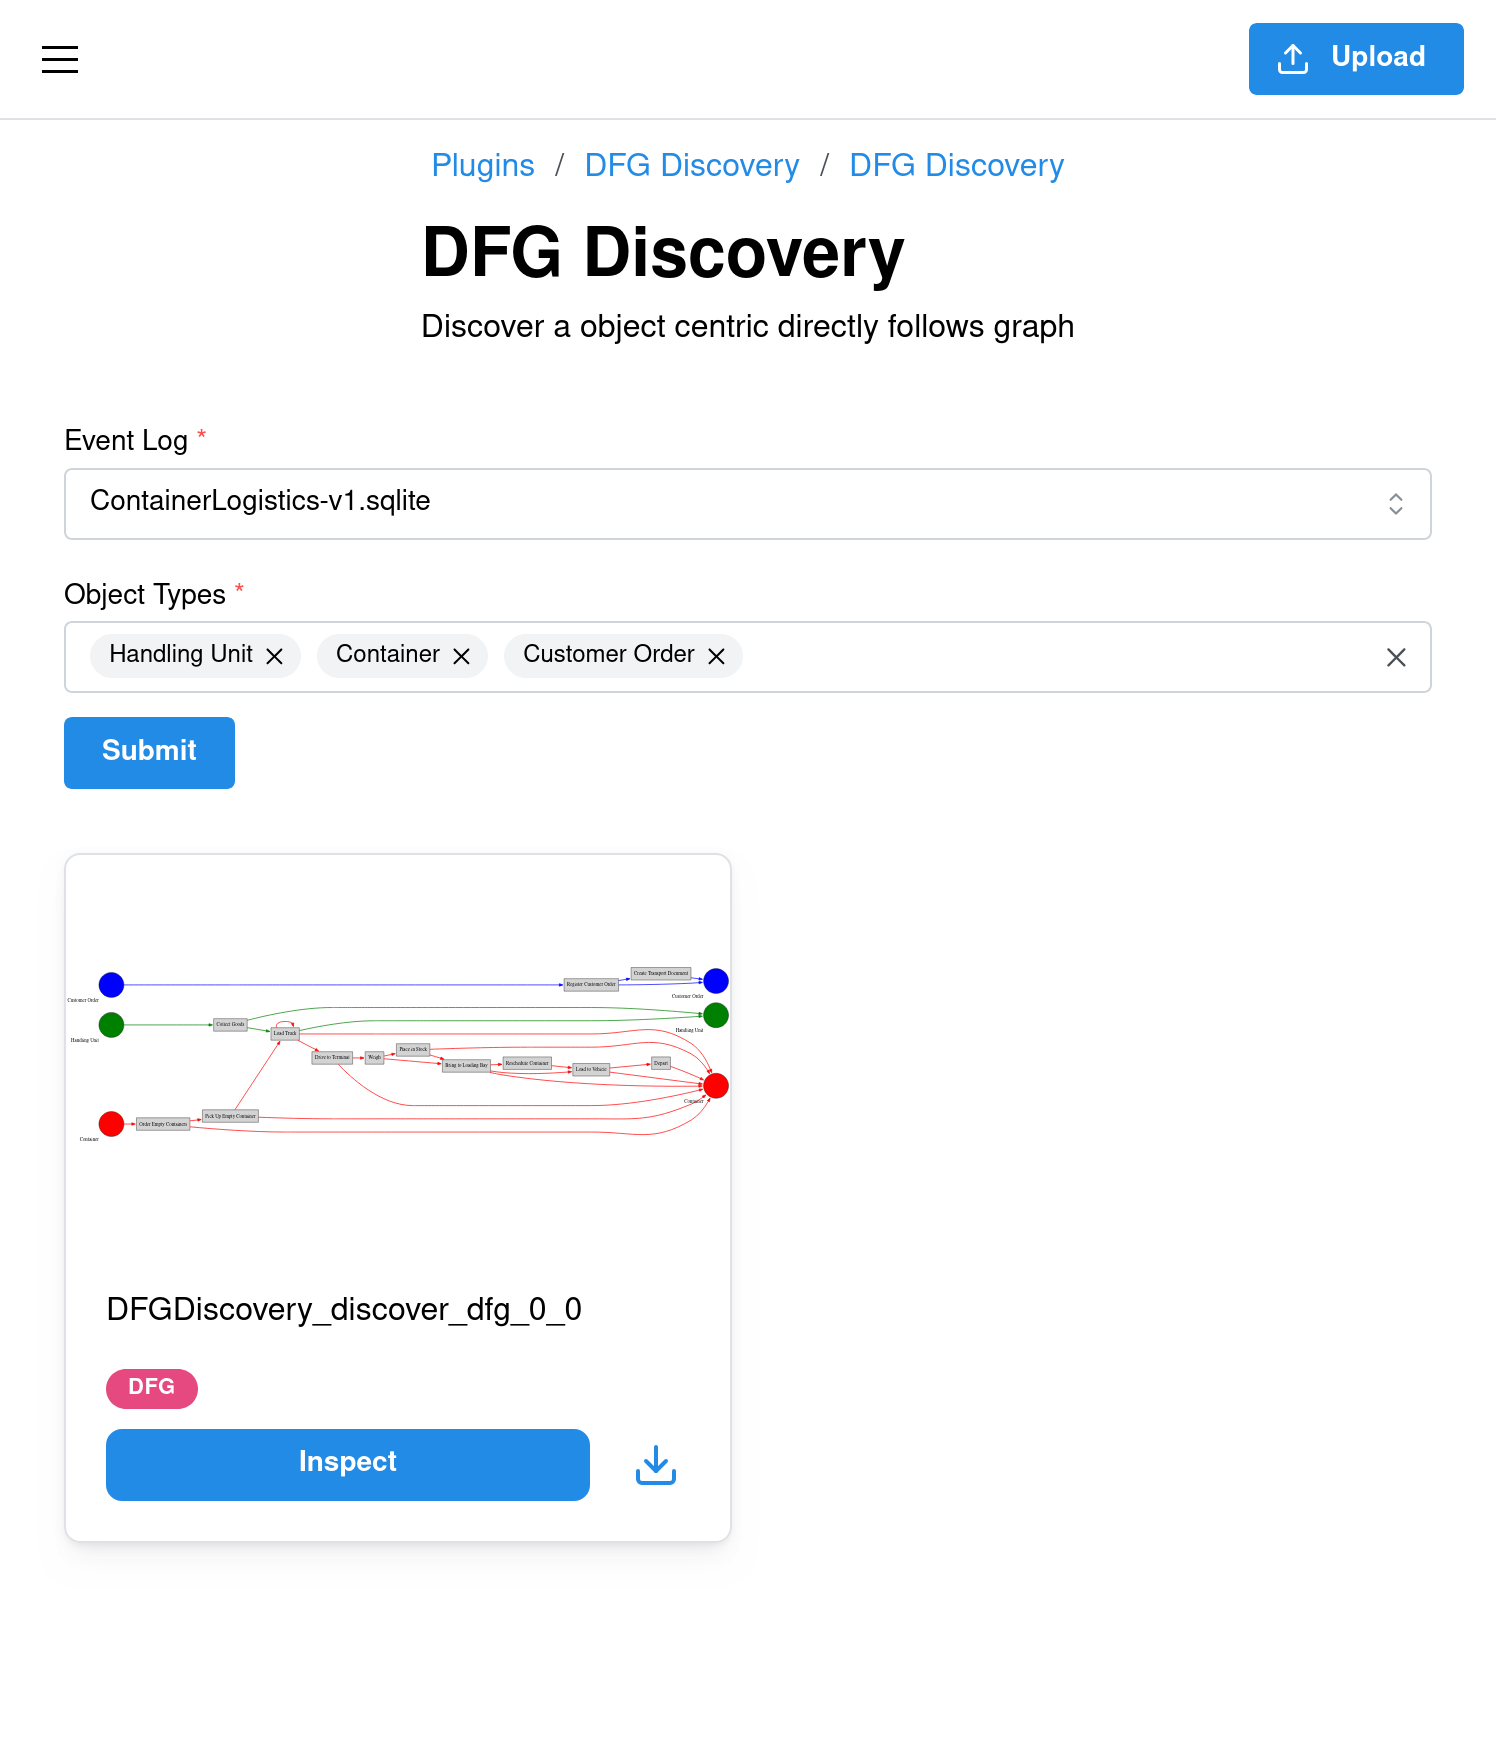
By the end of this evaluation, you will have a working plugin that looks like this:
For additional context or examples, you can use the Plugin Development Guide and the Tutorial.
Everything you need to complete this evaluation is included here, but if you're curious and want to explore the topic further, those guides provide a deeper look into plugin development in Ocelescope.
Step 1: Crash course in Ocelescope
Before we start building our plugin, let's take a quick look at the main building blocks of an Ocelescope plugin. Understanding these core concepts will make it easier to follow the next implementation steps.
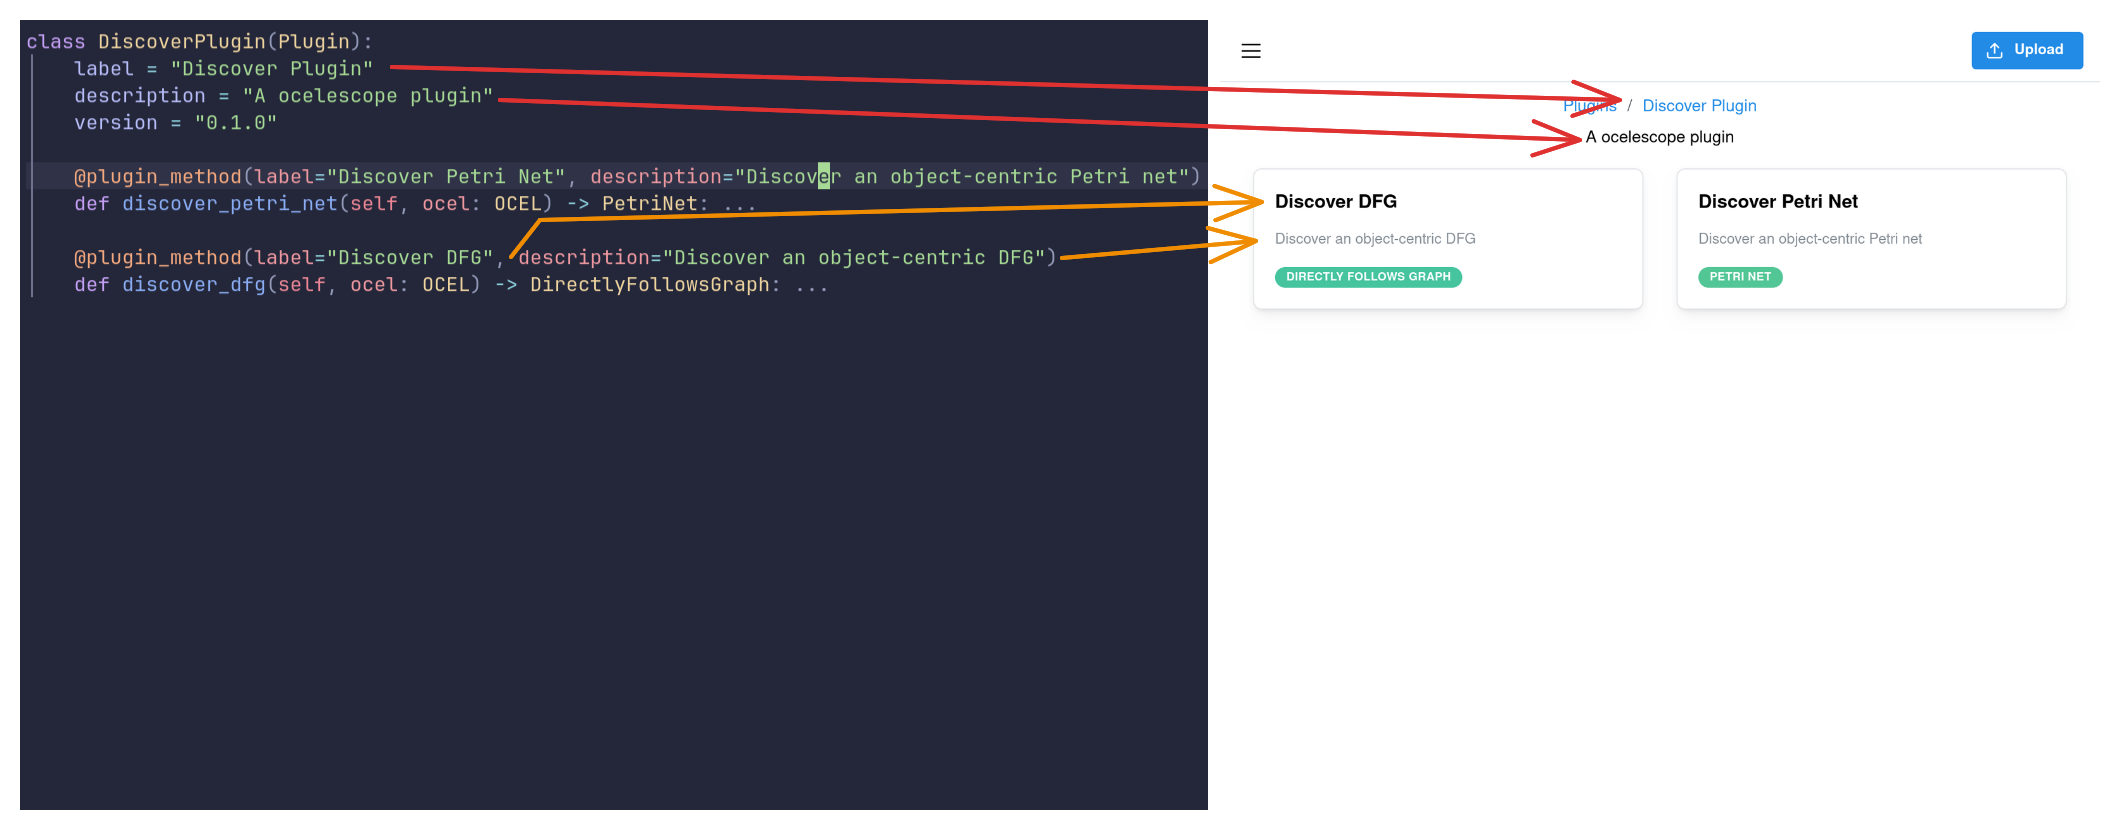
Plugin Class
An Ocelescope plugin is a collection of Python functions grouped inside a class that inherits from the base Plugin class provided by the ocelescope package.
Each plugin includes basic metadata, such as its name, version, and description, defined as class variables. Each function inside a plugin class that is decorated with @plugin_method becomes a callable action in the Ocelescope interface.
Resources
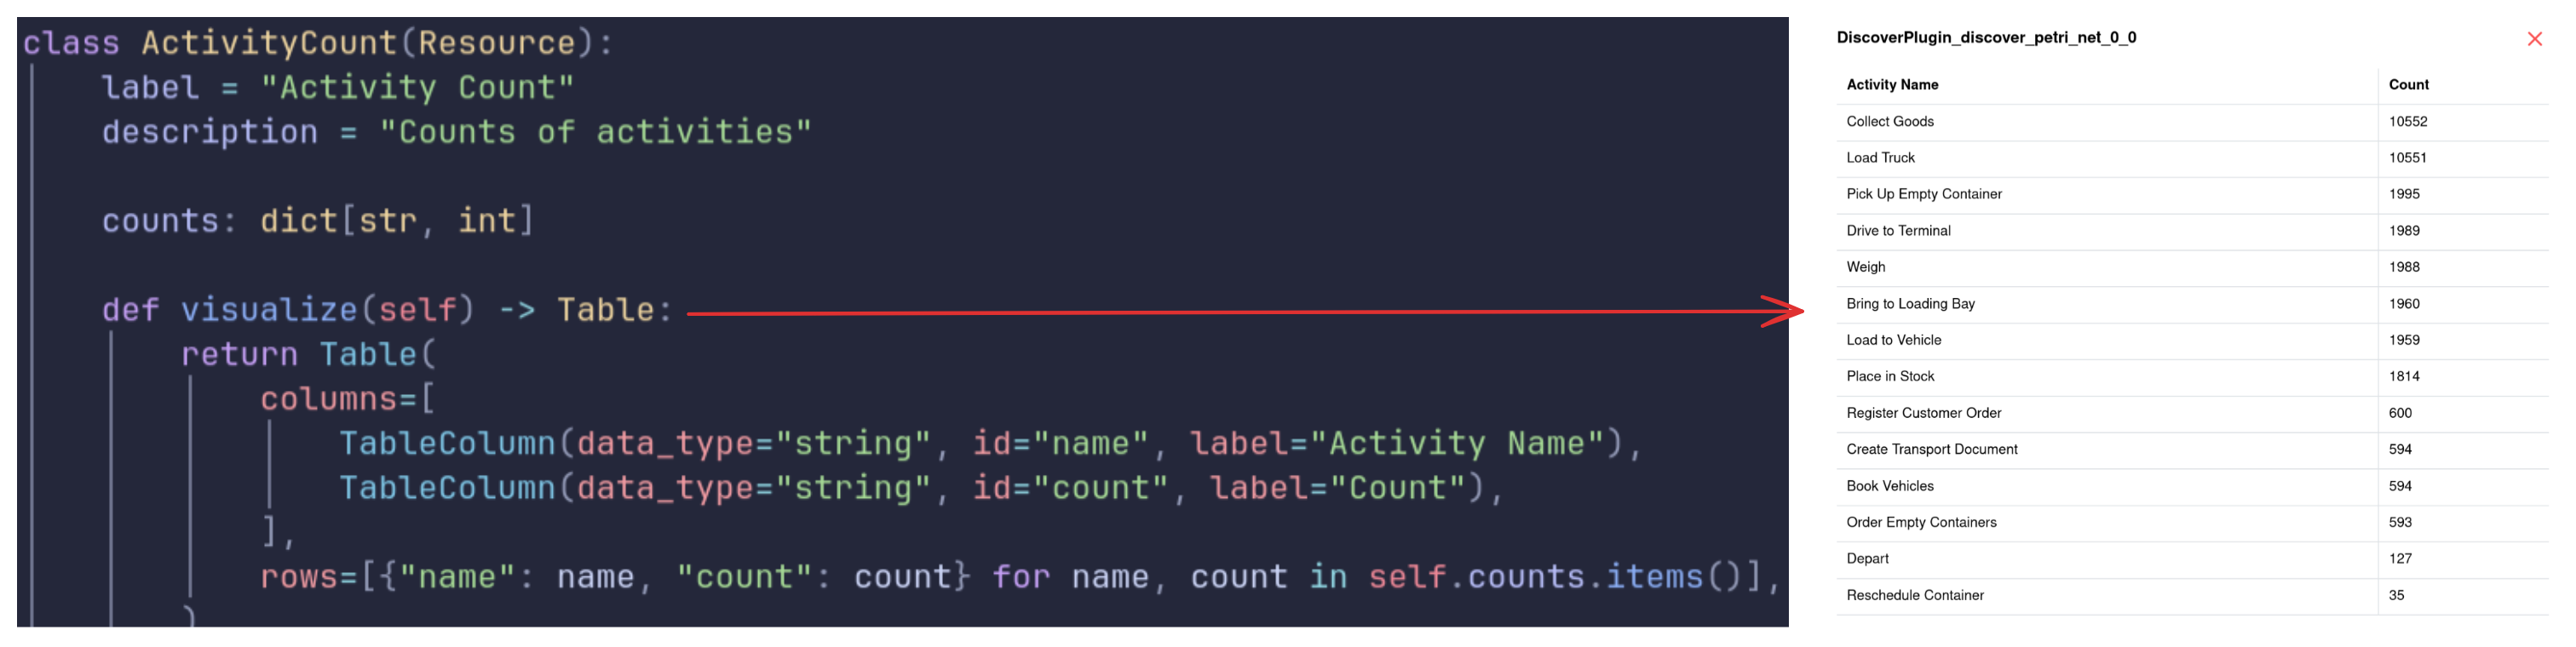
Resources are Python classes that can be used as inputs and outputs of plugin methods. They can represent process models, results of performance analyses, or any other structured data.
Resources returned by plugin methods are automatically saved and can be reused as inputs for other methods. A resource is a Python class that inherits from ocelescope.Resource.
A resource can optionally implement a visualization function, which returns one of Ocelescope’s built-in visualization types. This allows the resource to be displayed automatically in the frontend.
Plugin Methods
As discussed earlier, plugin methods are functions defined inside a plugin class. Their input parameters automatically generate a corresponding form in the Ocelescope frontend.
A plugin method can have any number of parameters of type OCEL or Resource. In addition, it can include one plugin input parameter, defined by creating a custom class that inherits from the PluginInput base class provided by the ocelescope package.
This custom class, called a configuration input, defines the user-configurable parameters for the plugin method.
Example: Defining a Plugin Method with an OCEL and a Custom Input Class
The following example shows how a plugin method can include both an OCEL parameter and a custom input class that inherits from PluginInput. The input class adds extra configurable parameters, in this case a numeric frequency field.
You can also define special OCEL-dependent fields within the same class using the OCEL_FIELD helper.
This helper links a field to the OCEL parameter of a plugin method, allowing you to create input fields that are automatically populated with elements such as object types, activities, or attribute names from the referenced OCEL log.
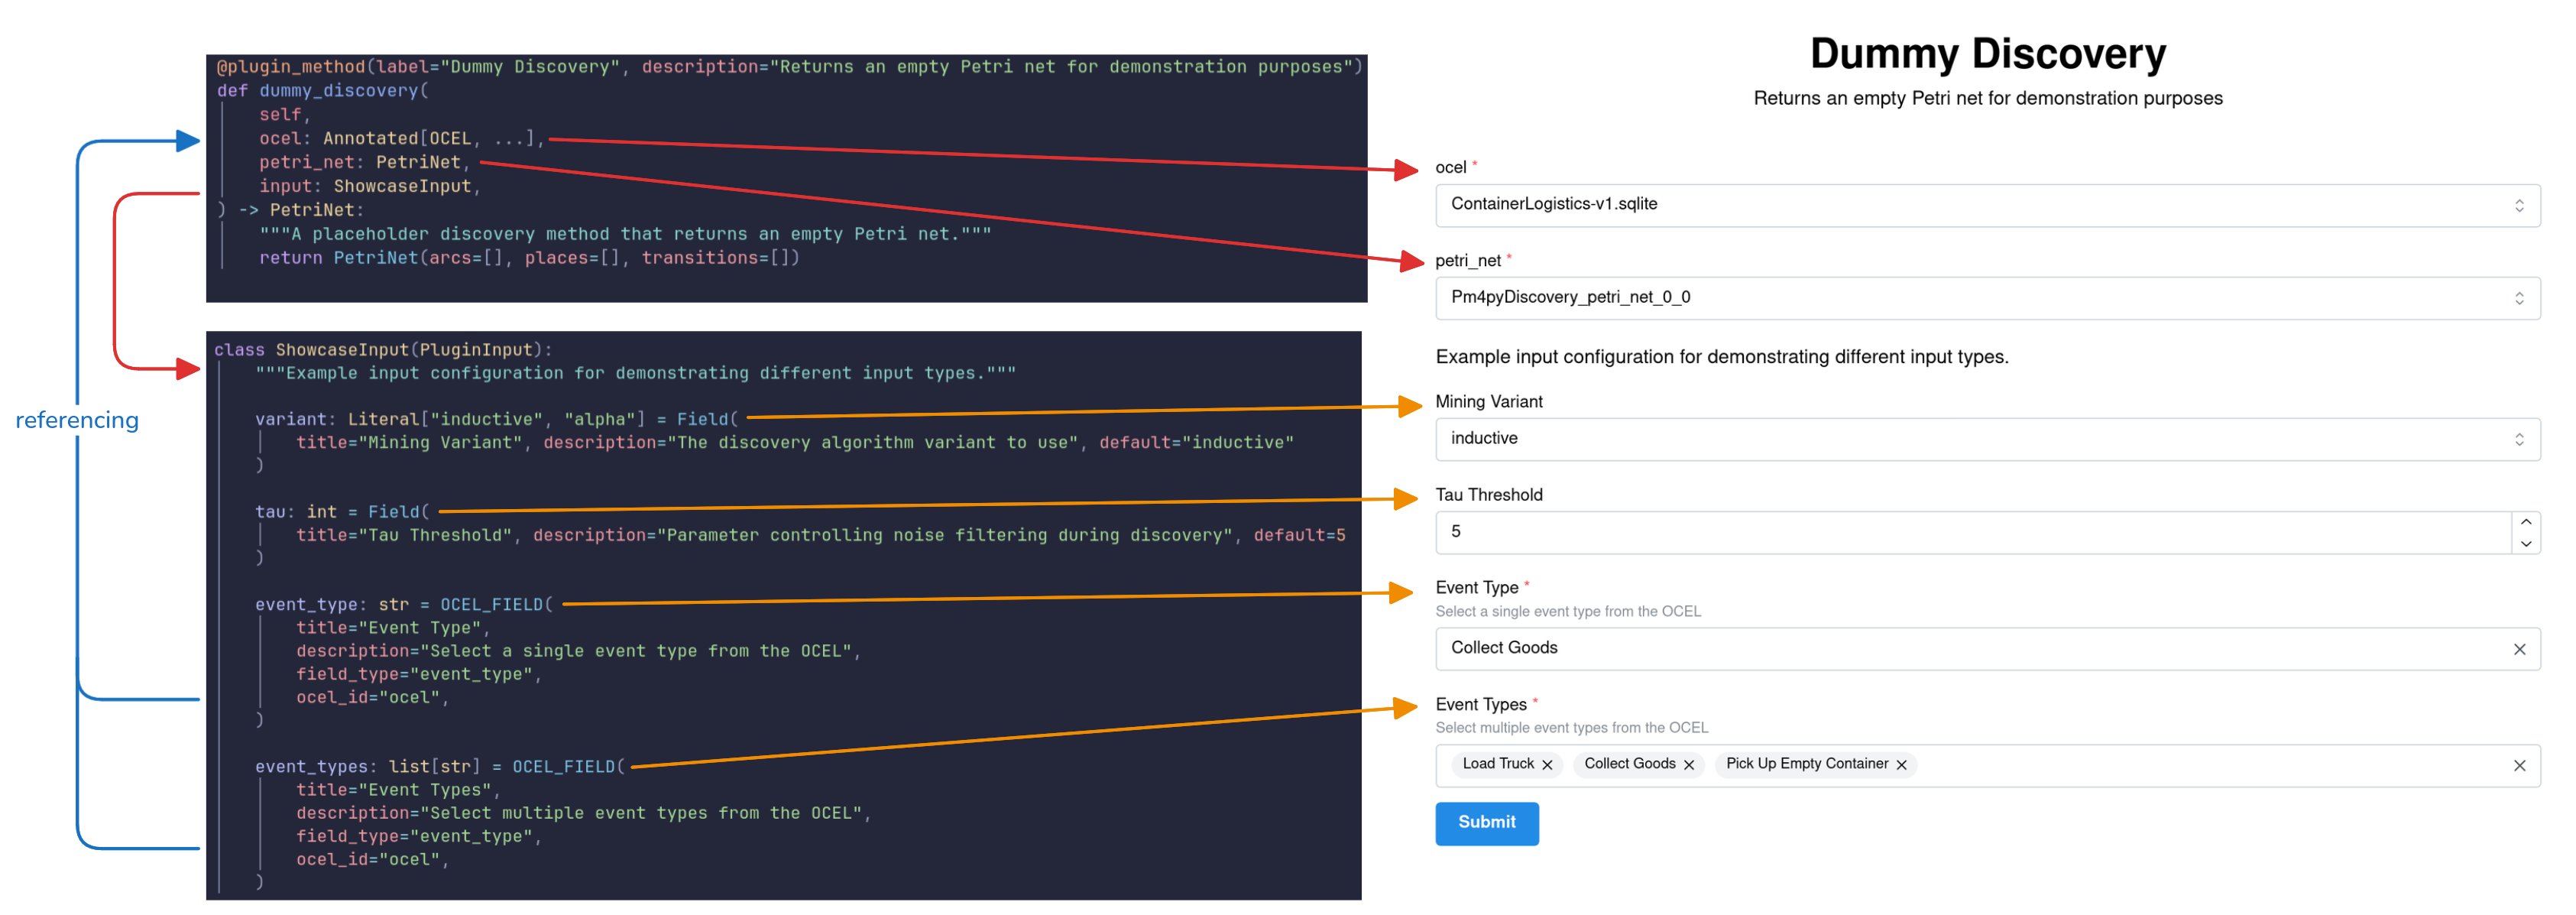
Example: Using OCEL-dependent fields
This example shows how to define OCEL-dependent fields using the OCEL_FIELD helper, which links a field (here, event_types) to the OCEL parameter of the plugin method. The ocel_id value must match the name of the corresponding OCEL parameter.
Step 2: Set Up Your Environment
Let's start by setting up the minimal Ocelescope plugin template.
You can choose one of the following two methods to prepare your project.
Option A - Clone the Template from GitHub
Clone the minimal plugin template directly from Github (link to the repository):
Option B - Generate a New Project with Cookiecutter
Alternatively, you can generate a new plugin project using Cookiecutter through uv:
Warning
When running the Cookiecutter template, always use the default options (press Enter for each prompt). This ensures the generated project matches the structure expected in this evaluation.
When you’ve completed the setup steps above, your project directory should look like this:
minimal-plugin/ <- root
├─ LICENSE
├─ README.md
├─ pyproject.toml
├─ requirements.txt
├─ src/
│ ├─ minimal_plugin/
│ │ ├─ __init__.py
│ │ ├─ plugin.py
Install Dependencies
Navigate to the root of the project and install all dependencies using your preferred package manager.
Warning
This evaluation requires Python 3.13. Make sure you have it installed before continuing.
Step 3: Implement the Plugin
After setting up the project and becoming familiar with how Ocelescope plugins work, we'll now implement our first real plugin: a discovery plugin for object-centric directly-follows graph (OC-DFGs), as introduced earlier.
The plugin will have the following components:
Inputs
- An OCEL log
- A list of object types to include in the discovery
Outputs
- A custom OC-DFG Resource containing the discovered directly-follows graph
Step 3.1 Prepare the Template
The plugin template we set up earlier provides a plugin.py file that already includes boilerplate code for a minimal Ocelescope plugin. It contains a plugin class, a resource, and an input class.
Initial state of plugin.py
Rename the Resource
- Rename the class
MinimalResourcetoDFG. - Update the
labelanddescriptionto indicate that the resource represents an object-centric directly-follows graph.
Rename the Plugin Class
- Rename the class
MinimalPluginto a meaningful name, for exampleDiscoverDFG. - Update the
labelanddescriptionfields to describe the new plugin. -
Adapt the import in
__init__.pyto reflect the new class name.
Rename the Plugin Method
- Rename the method
exampleto a descriptive name, for examplediscover. - Update the method’s
labelanddescriptionfields to describe its purpose. -
Adjust the return type hint of the method to use the renamed resource (for example, change
MinimalResourcetoDFG).
Add the Utility File
To keep your plugin code clean and organized, we will place the discovery and visualization functions in a separate file named util.py.
You can either download the ready-made util.py file or create a new util.py file yourself. In both cases, place it next to your plugin.py (i.e. at src/minimal_plugin/util.py).
The Discovery and Visualization implementation
You don’t need to fully understand the implementation of these functions to complete this evaluation. They are provided as ready-to-use helpers that you will later integrate into your Ocelescope plugin.
| util.py | |
|---|---|
1 2 3 4 5 6 7 8 9 10 11 12 13 14 15 16 17 18 19 20 21 22 23 24 25 26 27 28 29 30 31 32 33 34 35 36 37 38 39 40 41 42 43 44 45 46 47 48 49 50 51 52 53 54 55 56 57 58 59 60 61 62 63 64 65 66 67 68 69 70 71 72 73 74 75 76 77 78 79 80 81 82 83 84 85 86 87 88 89 90 91 92 93 94 95 96 97 98 99 100 101 102 103 104 105 106 107 108 109 110 111 112 113 114 115 116 117 118 119 120 121 122 123 124 | |
After completing the previous steps, your project directory should look like this:
minimal-plugin/
├─ ...
├─ src/
│  ├─ minimal_plugin/
│  │  ├─ __init__.py
│  │  ├─ plugin.py
│  │  ├─ util.py
Solution 1
Step 3.2 Integrate the Discovery Functions
Now that the structure is in place, we can integrate the discovery and visualization functions into the plugin to make it functional.
Extend the Resource
Since our plugin returns a directly-follows graph, we should add an edges field (class attribute) to our DFG resource to store the discovered relationships.
The discovery method provided in the util.py returns the OC-DFG as a list of tuples discover_dfg(...) -> list[tuple[str | None , str, str | None]]. To integrate this into our Resource, extend your DFG class to hold this data.
-
Add a field (class attribute) named
edgeswith the following type:
Solution 2
Add a visualization to the Resource
Our DFG resource can already be used as both an input and an output, but currently it only stores data without any visual representation.
To display it visually in the Ocelescope frontend, we can extend its visualize method.
The provided util.py file already includes a helper function, convert_dfg_to_graphviz, which takes the resource's edges as input and returns a graphviz.Digraph instance.
Ocelescope supports several visualization types, including DotVis, which renders Graphviz DOT strings.
A DotVis instance can be created directly from a graphviz.Digraph by using DotVis.from_graphviz(...).
Inside the visualize method of your DFG class:
-
Import the
convert_dfg_to_graphvizfrom theutil.pyas a relative import.Use only relative imports
Ocelescope plugins must use relative imports when referencing files in the same directory.
-
Call the
convert_dfg_to_graphvizwith the resource'sedgesfield. -
Return a
DotVisinstance created withDotVis.from_graphviz(...).Tip
- You can access the edges through
self.edges, assuming the field in yourDFGresource is namededges. - Make sure
DotVisis imported from theocelescopepackage before using it:
- You can access the edges through
Solution 3
Extend the Input Class
Now let's define the input of the discover function. Since we renamed the original example method inside the plugin class, it should already include an OCEL parameter named ocel.
Because the discovery function allows filtering by object type, we should also allow the user to select which object types to include. This is done by extending the Input class.
Inside the Input class (which inherits from PluginInput):
- Remove the existing
passstatement. - Add a new field (class attribute) called
object_typeswith the typelist[str] - Turn it into an OCEL-dependent field using the
OCEL_FIELDhelper, setting thefield_typeto"object_type"
Solution 4
Integrate the Implementation
After defining the inputs for our discovery and the Resource that will hold the result, we can now connect everything in the discover method of our plugin class.
In the discover method:
-
Import the
discover_dfgfunction as a relative import.Use only relative imports
Ocelescope plugins must use relative imports when referencing files in the same directory.
-
Call the
discover_dfgwith theocelparameter and theobject_typesfield from the input class, then use the result to create a new instance of theDFGresource. -
Return the created
DFGresource
Solution 5
Step 4: Build your plugin
That's it! The final step is to build your plugin. You can do this in one of two ways:
-
Manually, by creating a ZIP archive yourself:
-
Using the built-in Ocelescope build command (recommended):
Run the build command in the root of your project.
Make sure to execute it within the same Python environment where you installed your dependencies.
Or, depending on how you manage your environment:
After building, you'll find your packaged plugin as a .zip file inside the dist/ directory.
Solution 6
If you'd like, you can upload the ZIP file in the Ocelescope interface to test your plugin directly.
Once finished, return to the evaluation form to complete your assessment.