Resources
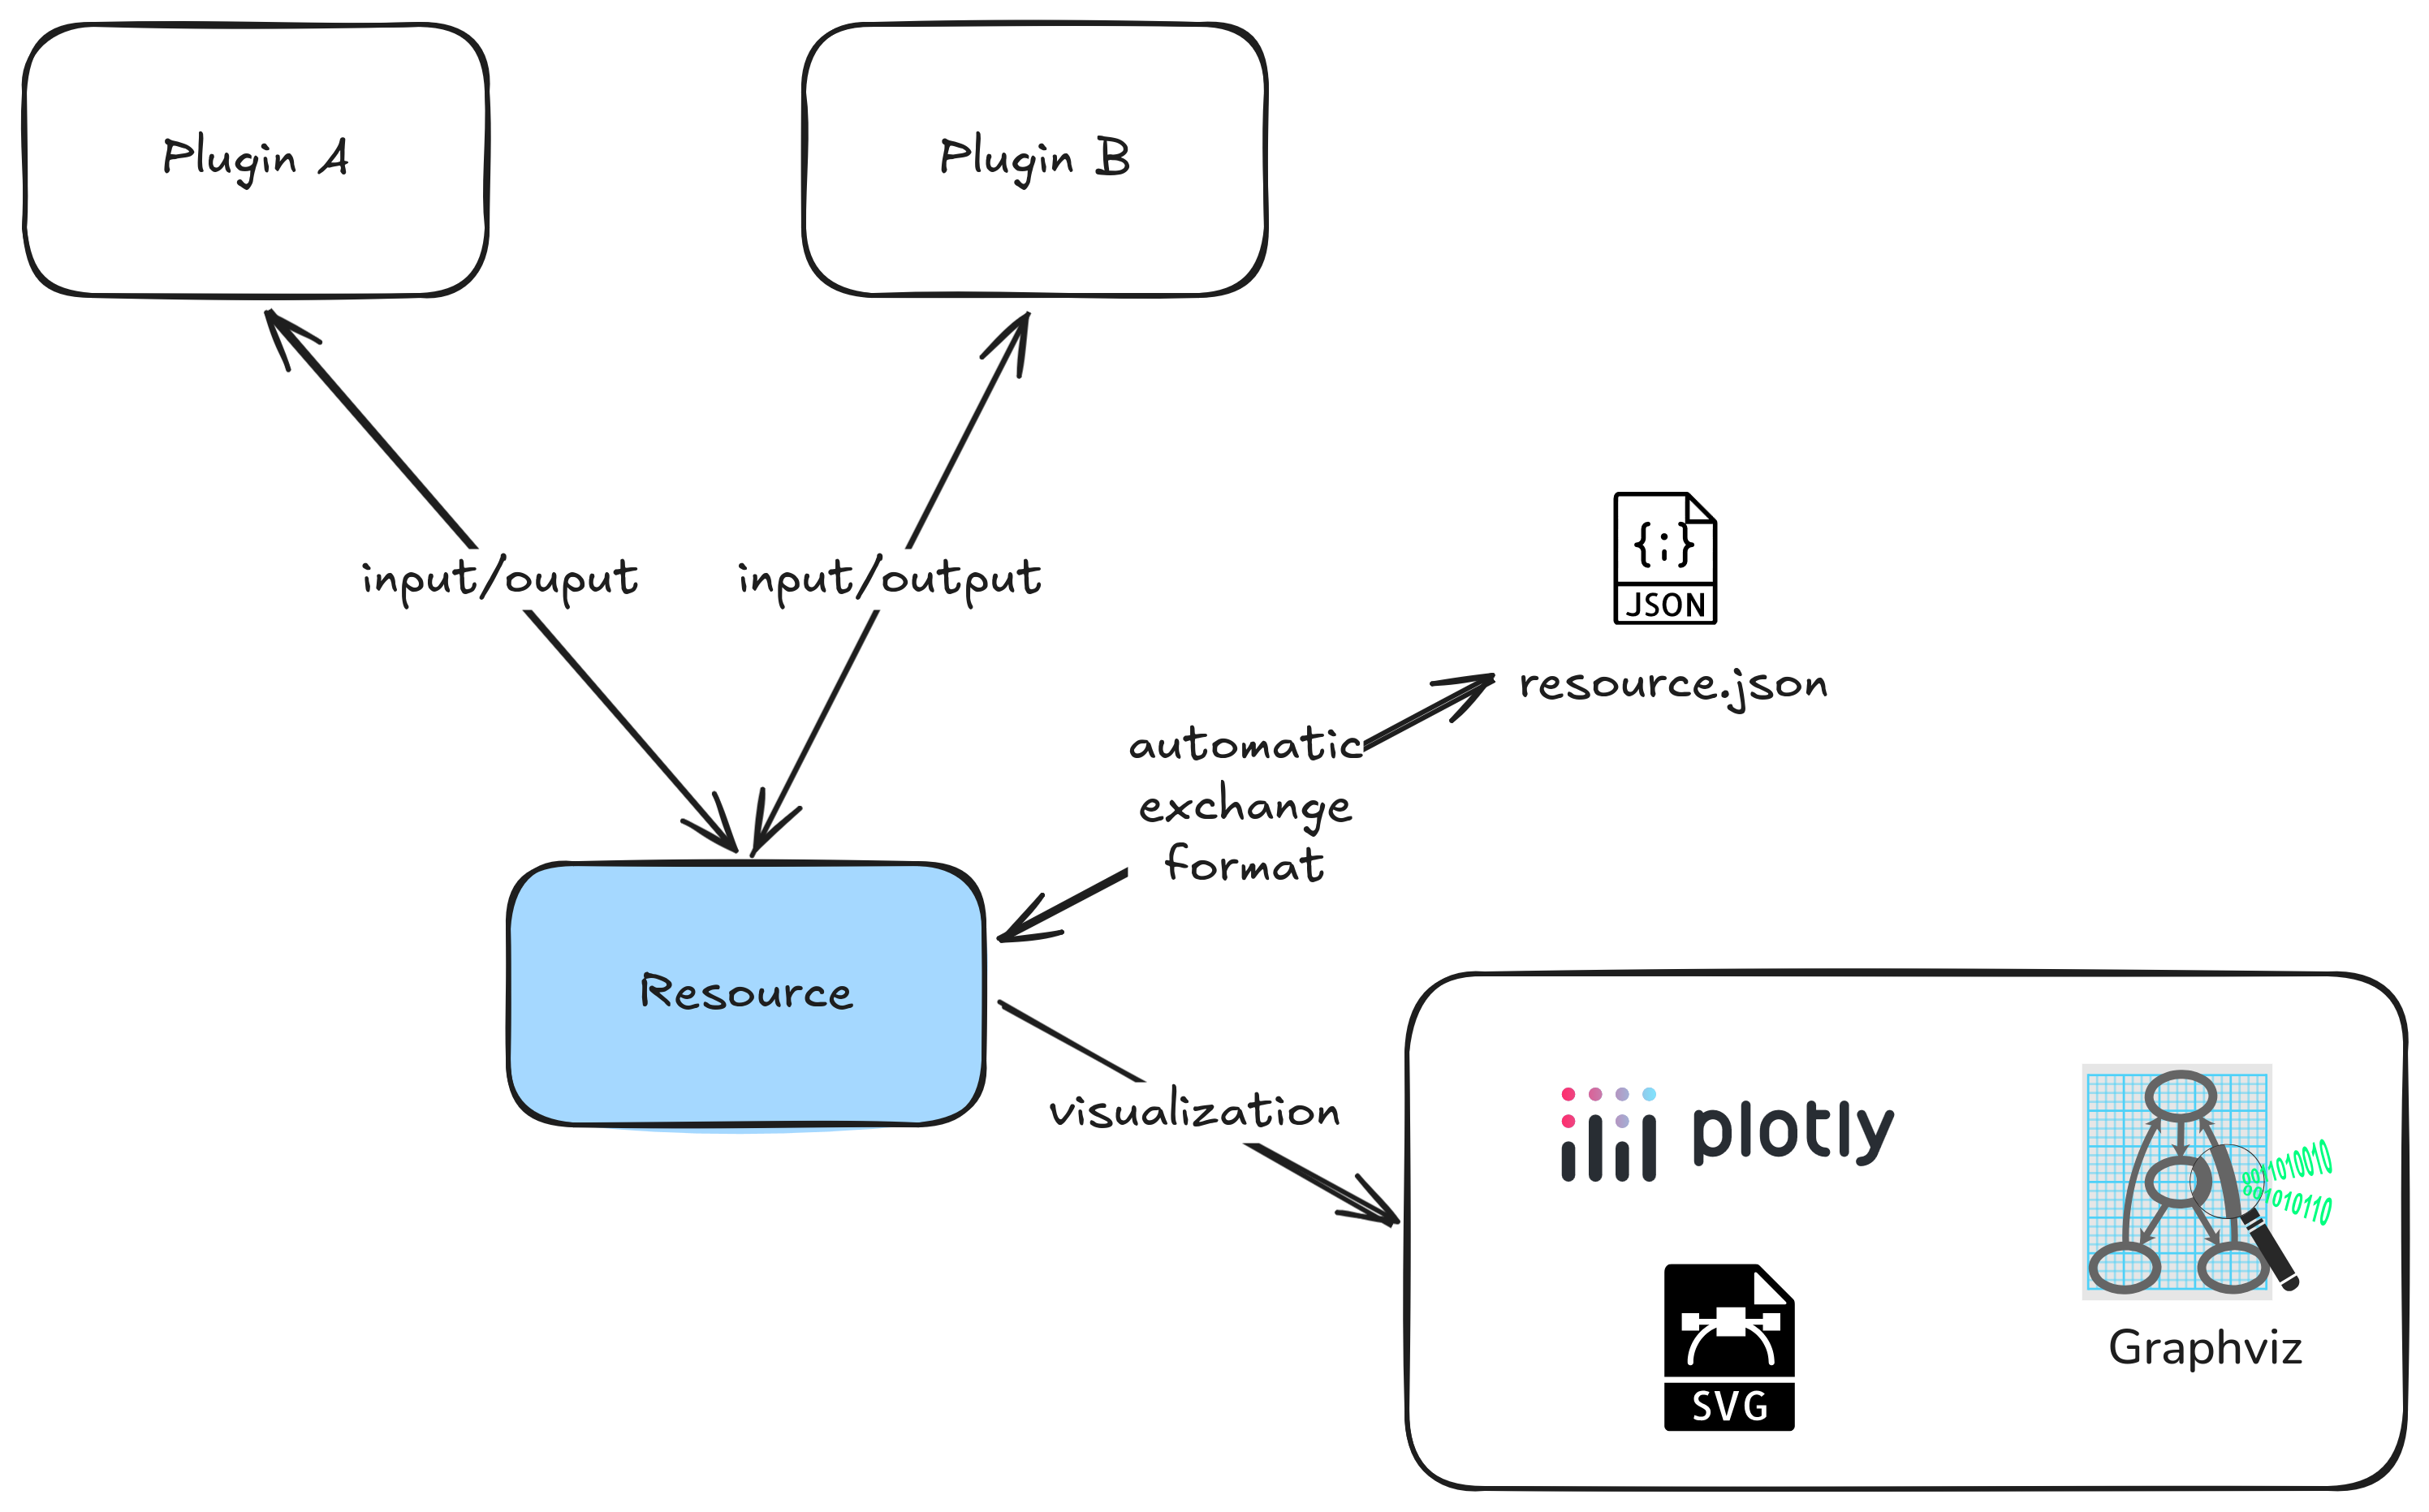
Resources are the main mechanism to define inputs and outputs of Ocelescope plugin methods.
When you define a resource, it becomes exportable and importable by default through an automatic exchange format.
Resources can also provide a visualization so they can be displayed in the frontend.
Defining a resource
Define a resource by creating a Python class that inherits from Resource (from the ocelescope package). The structure of the resource is described through typed fields on the class. You can also set label and description to control how the resource appears in the frontend.
If you want to reuse a resource across plugins, keep the class name and the field definitions identical.
| Example: defining a resource | |
|---|---|
Resources must be JSON-serializable
For import and export to work, a resource must be serializable and instantiable from its serialized form.
Use standard types like str, int, float, bool, list, or dict, or custom types that are themselves serializable.
If you use nested classes (for example, a resource that contains nodes and edges), make those nested classes Pydantic models (inherit from pydantic.BaseModel) so they can be validated and serialized consistently.
Using resources in plugin methods
Ocelescope inspects the type hints of plugin methods. Resource types used as parameters are treated as resource inputs, and resource types used as the return type are treated as resource outputs and saved in the session for later use.
Visualizing resources
Resources can provide a visualization so they can be displayed in the frontend. To do this, implement a visualize() method on your resource that returns one of the visualization classes provided by Ocelescope.
A simple example is to return a Plotly figure from your resource
Overview
| Class | Use case |
|---|---|
Graph | Interactive node/edge graph visualizations. |
DotVis | Rendering raw Graphviz DOT when you already have a DOT string. |
SVGVis | Render SVG markup. Useful when you generate SVG with another library (for example Matplotlib). |
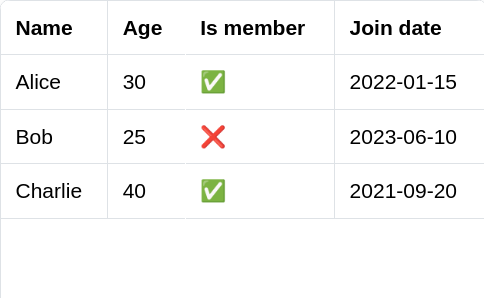
Table | Displaying structured data as a typed table (rows + columns). |
Plotly | Interactive charts built with Plotly. |
Examples
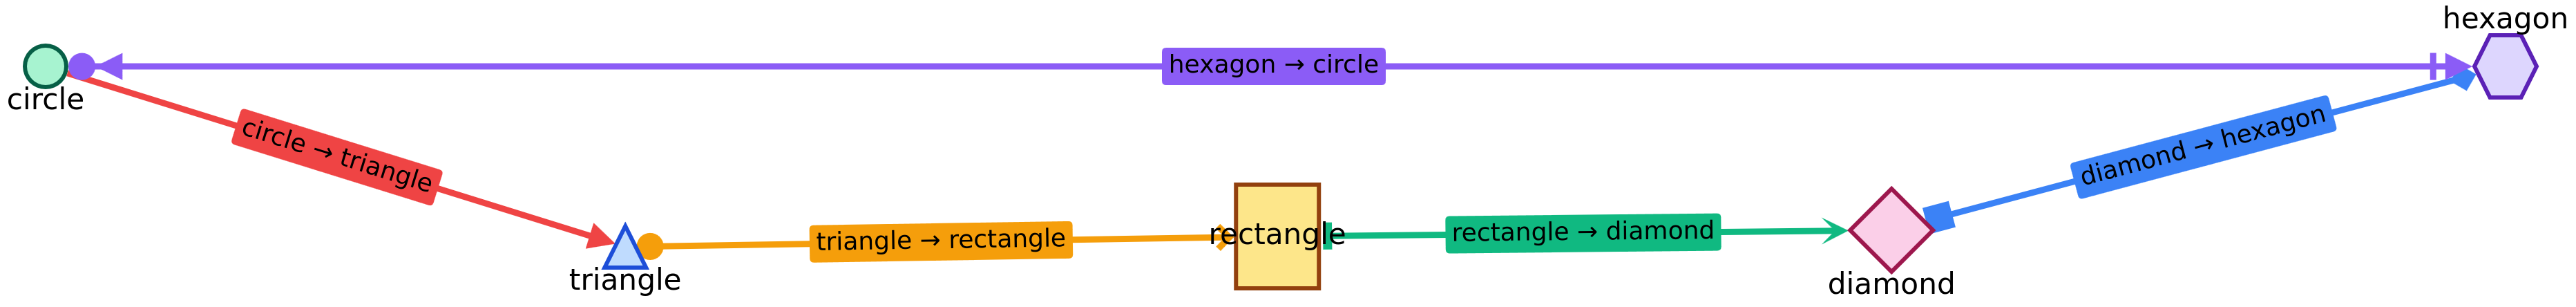
Basic graph Example (Graph)
Code
1 2 3 4 5 6 7 8 9 10 11 12 13 14 15 16 17 18 19 20 21 22 23 24 25 26 27 28 29 30 31 32 33 34 35 36 37 38 39 40 41 42 43 44 45 46 47 48 49 50 51 52 53 54 55 56 57 58 59 60 61 62 63 64 65 66 67 68 69 70 71 72 73 74 75 76 77 78 79 80 81 82 83 84 85 86 87 88 89 90 91 92 93 94 95 96 97 98 99 100 101 102 103 104 105 106 107 108 109 110 111 112 113 114 115 116 117 118 119 | |
SVG through markup (SVGVis)
Code

SVG through matplotlib (SVGVis)
Code

Table (Table)
Code
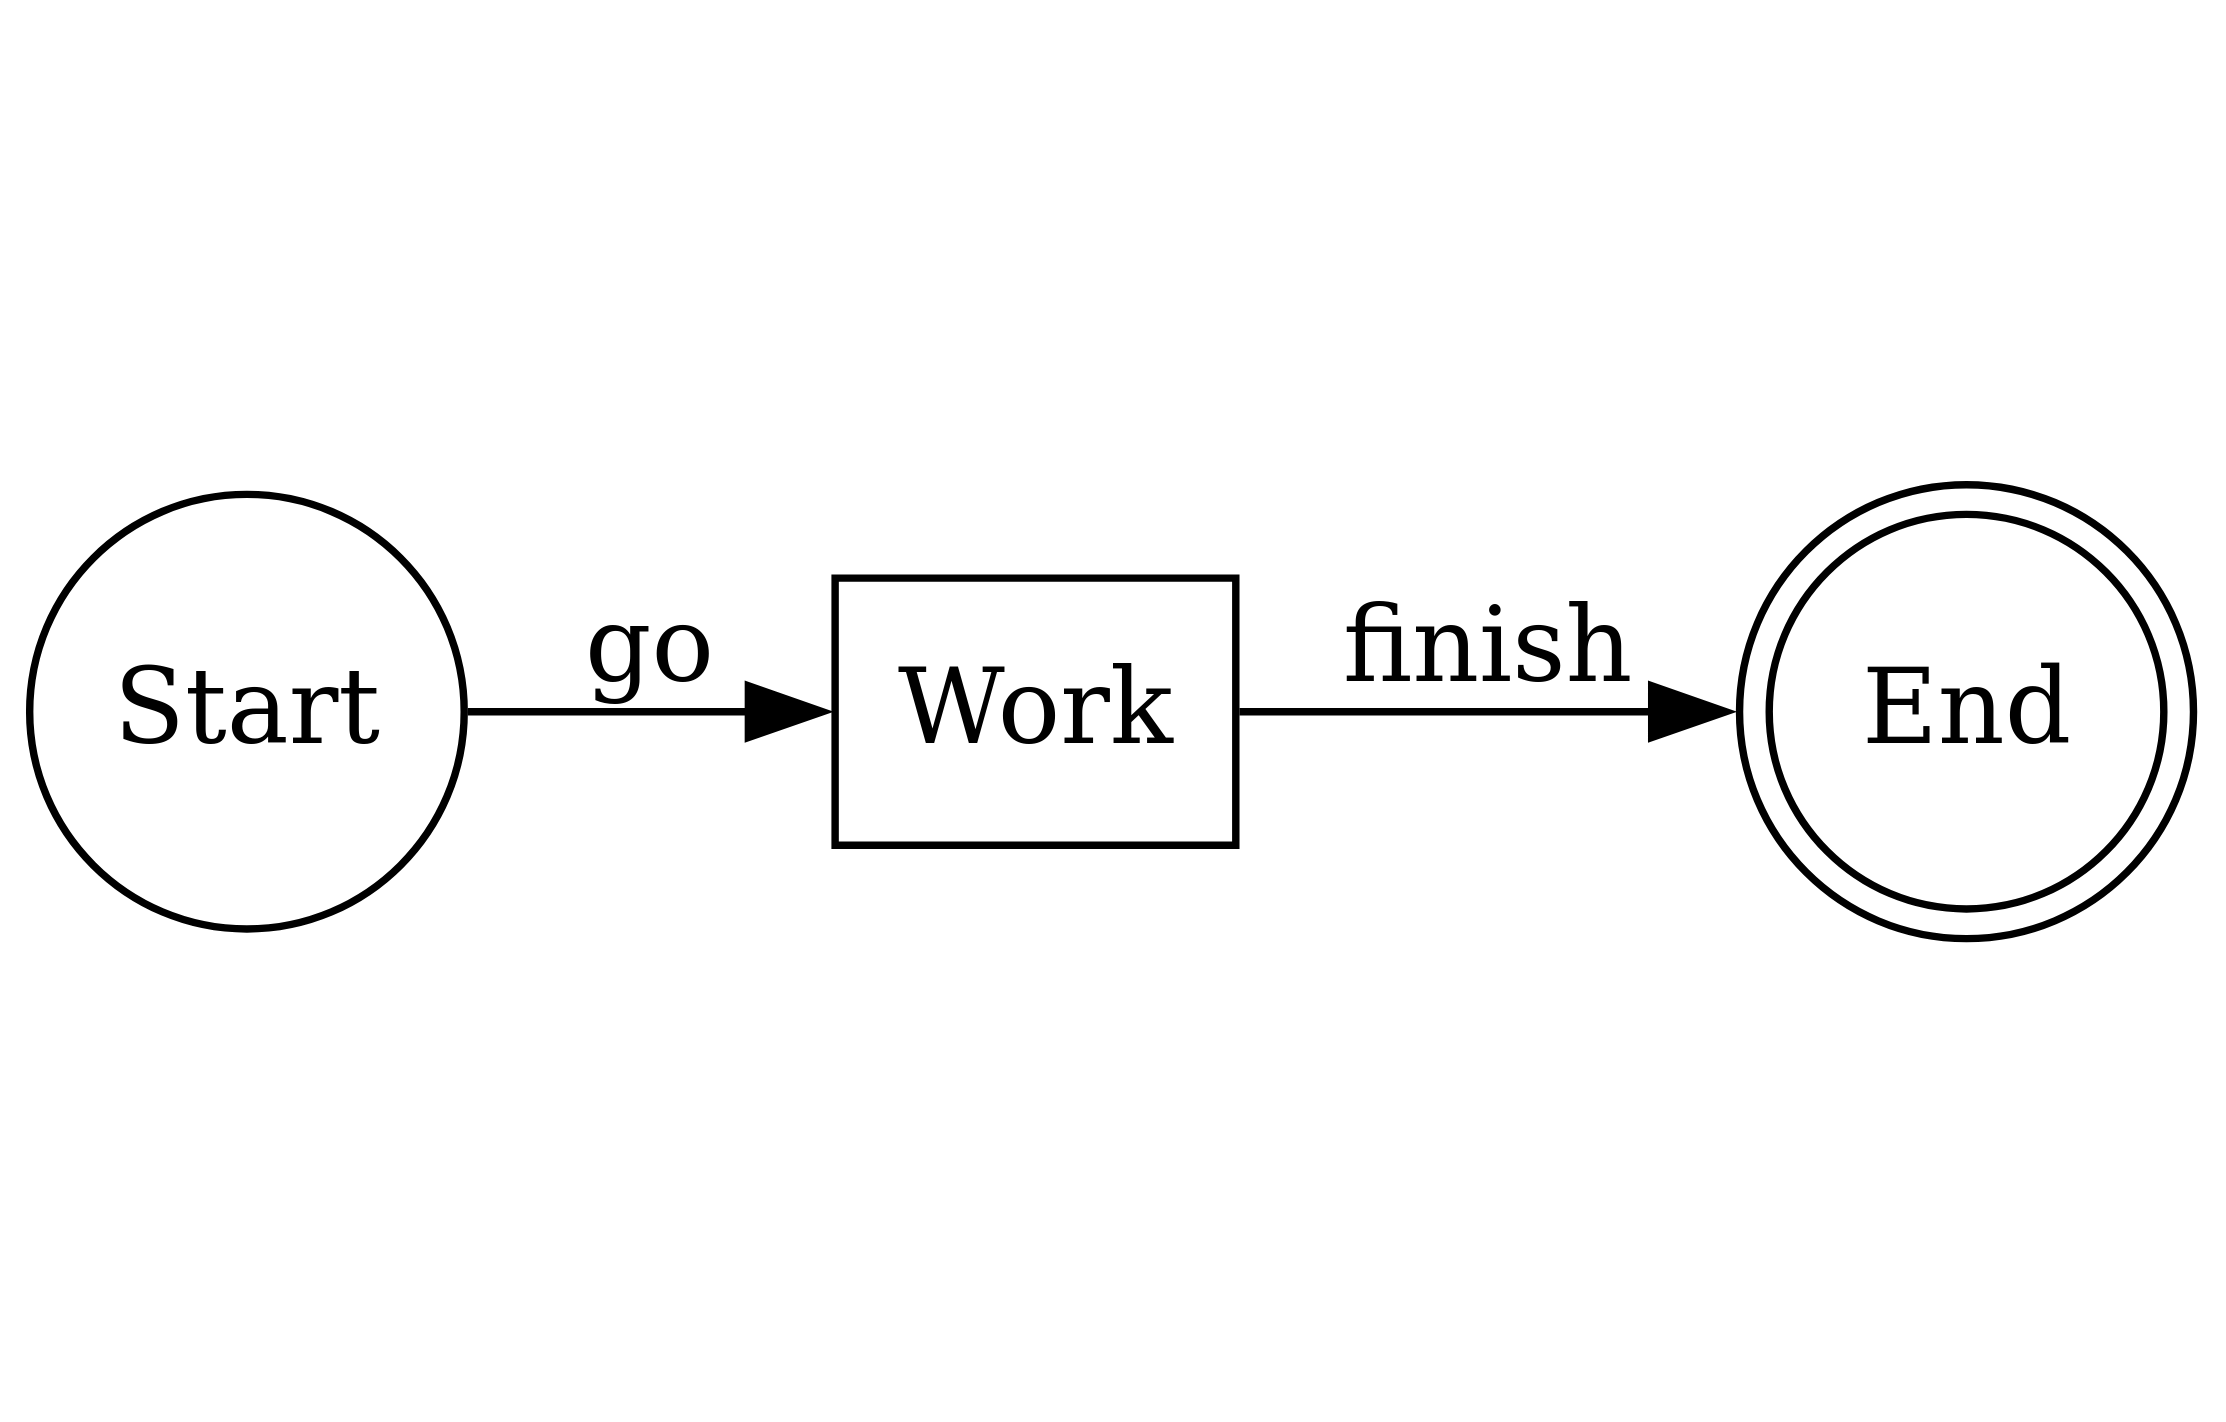
Dot (DotVis)
Code
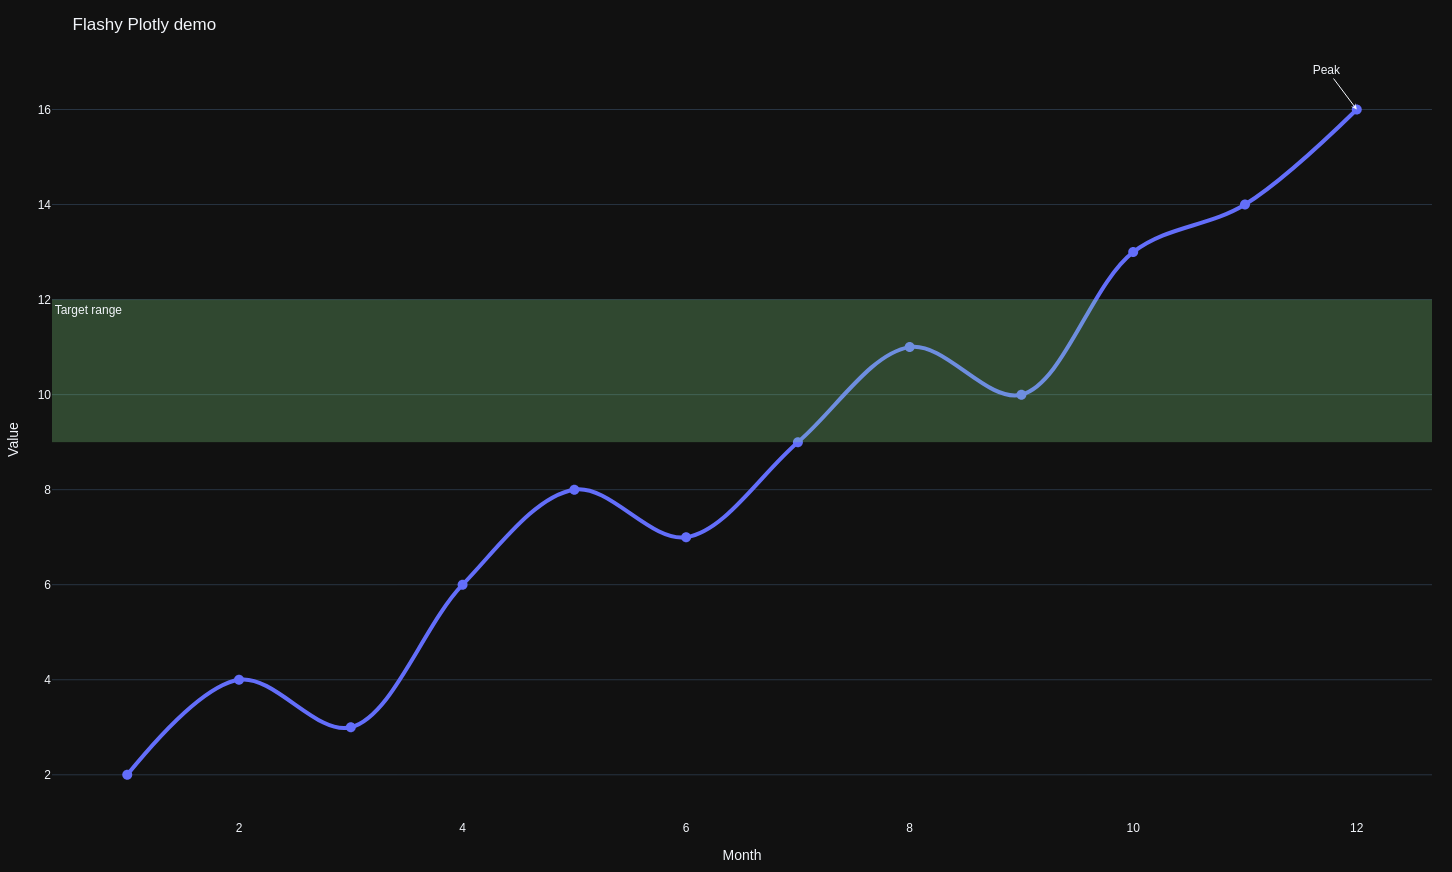
Plotly (Plotly)
Code
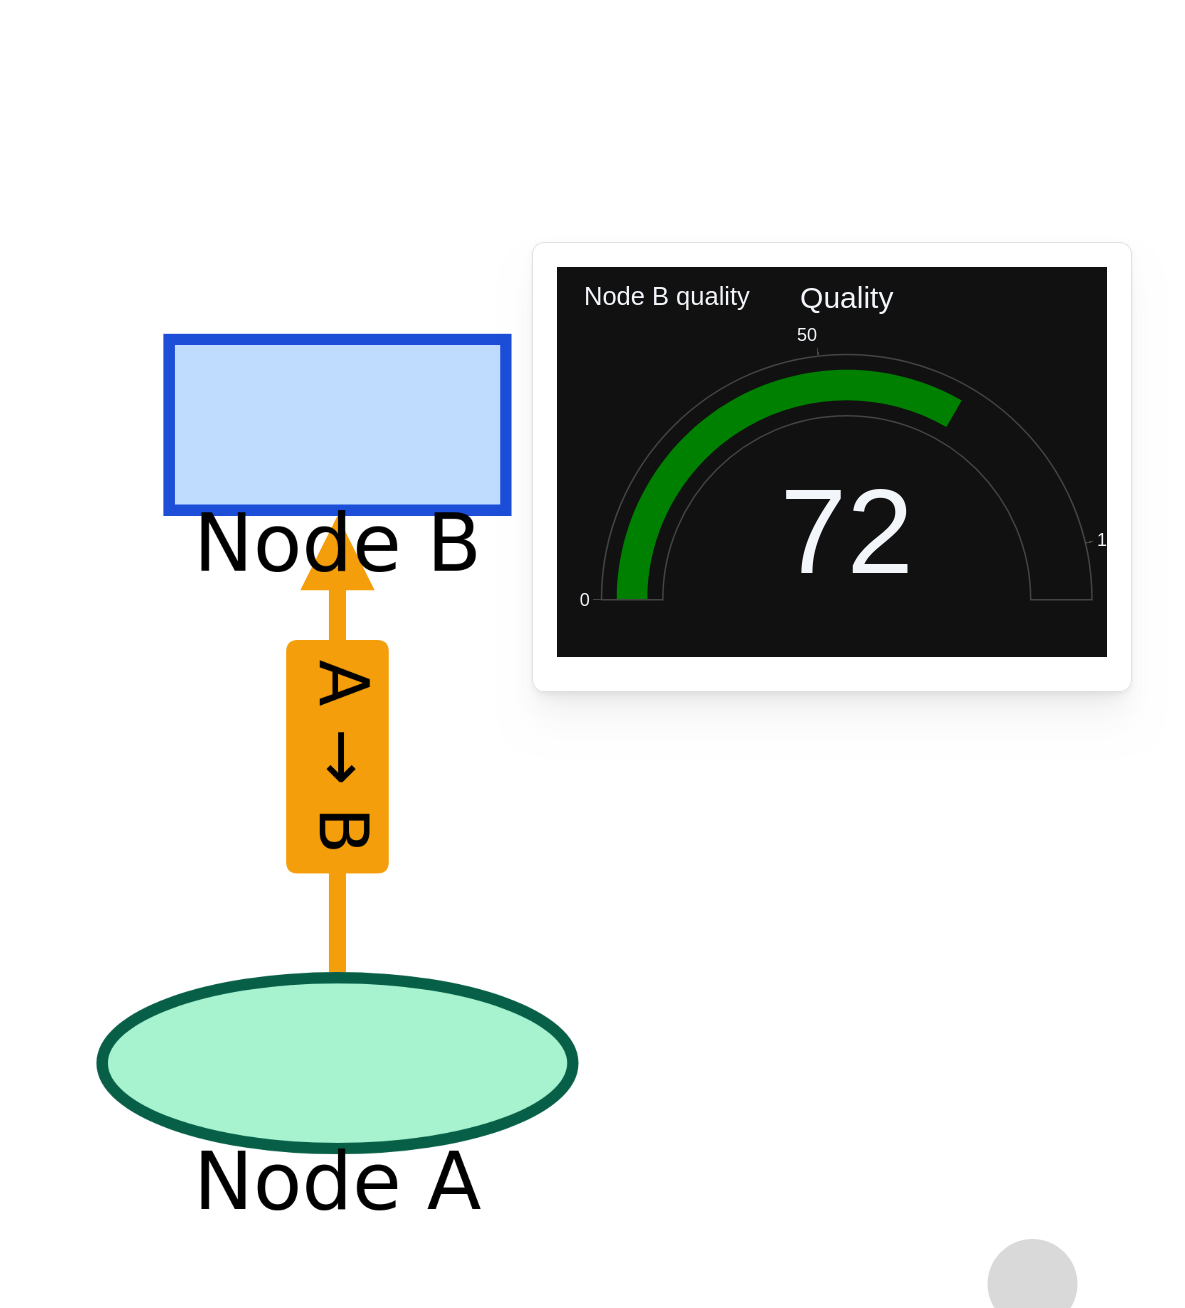
Graph with annotations (Graph)
You can annotate Graph nodes and edges with other visualizations, which the frontend can open when the user clicks the node or edge.
Code